How to use the Book stats page
In this article, you will find all the important information you need to be utilize our Book stats page which can be found under Analytics > Book stats
Filters
-
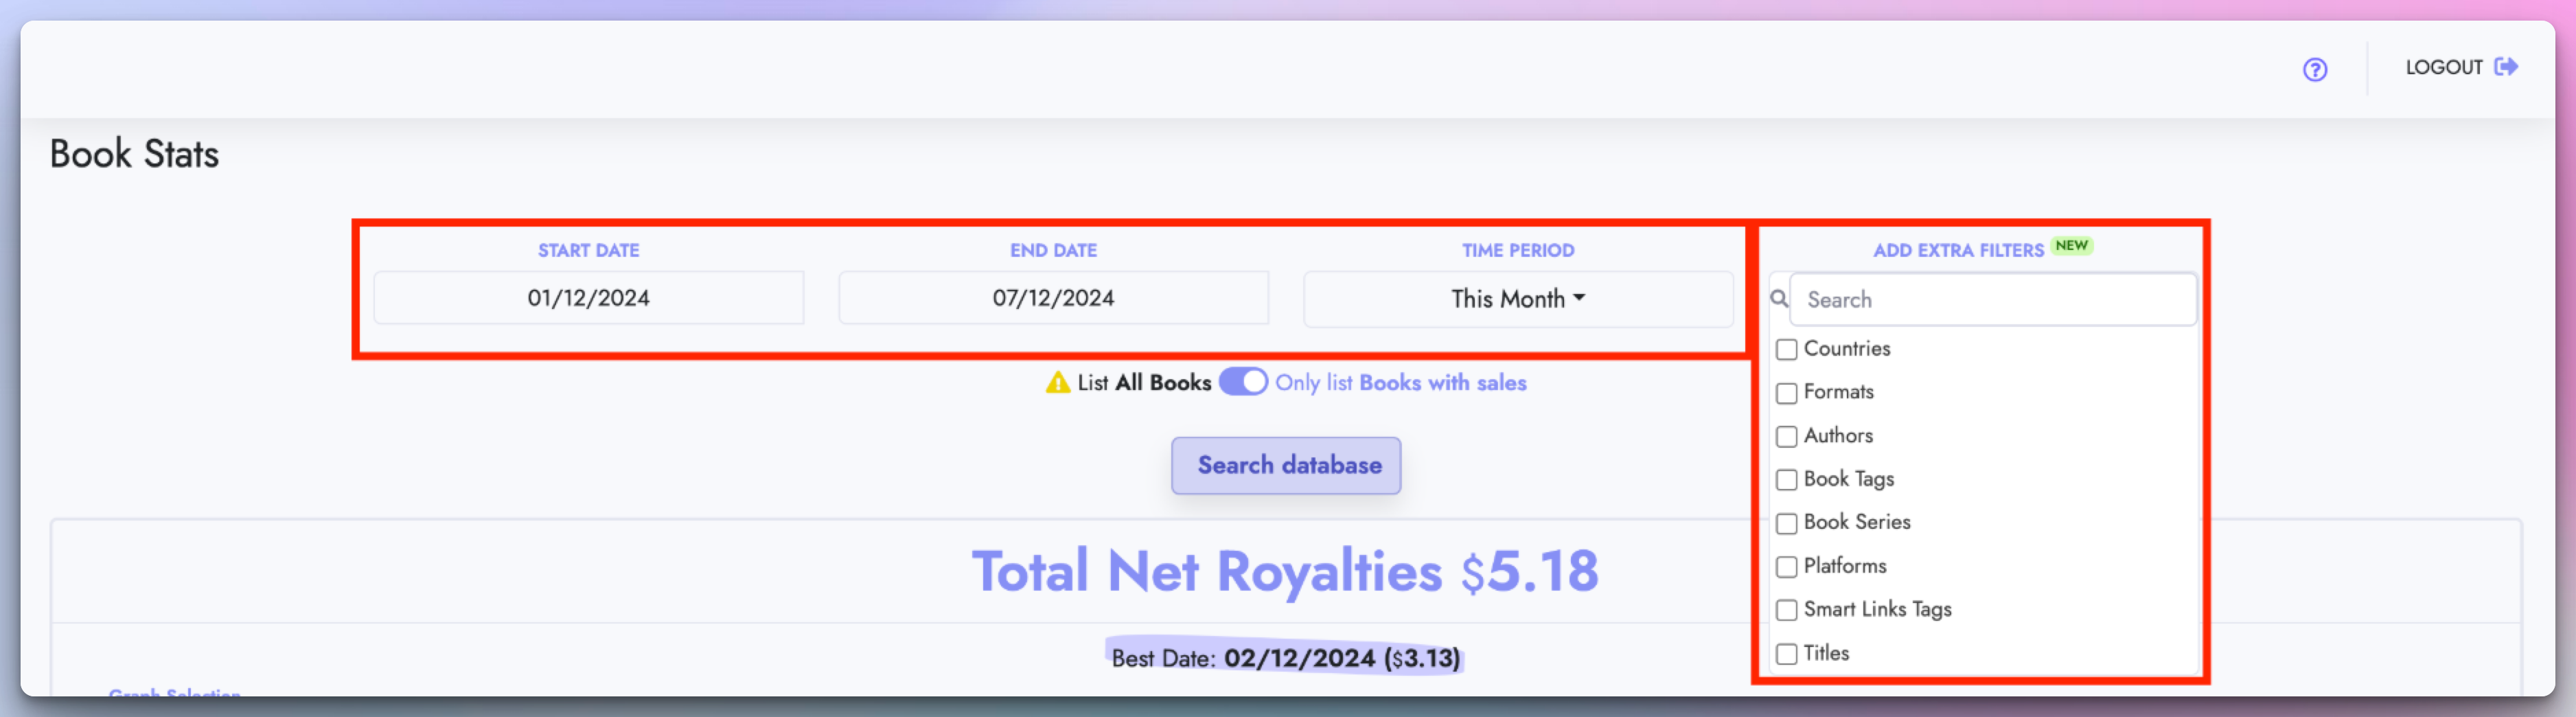
At the top of the page you have a list of filters you can use including Time period, Titles, Authors etc.
-
You can add or remove any number of filters to analyze your Books in any way you want.
-
Make sure to click "Search database" to apply your selected filters
Graphs
-
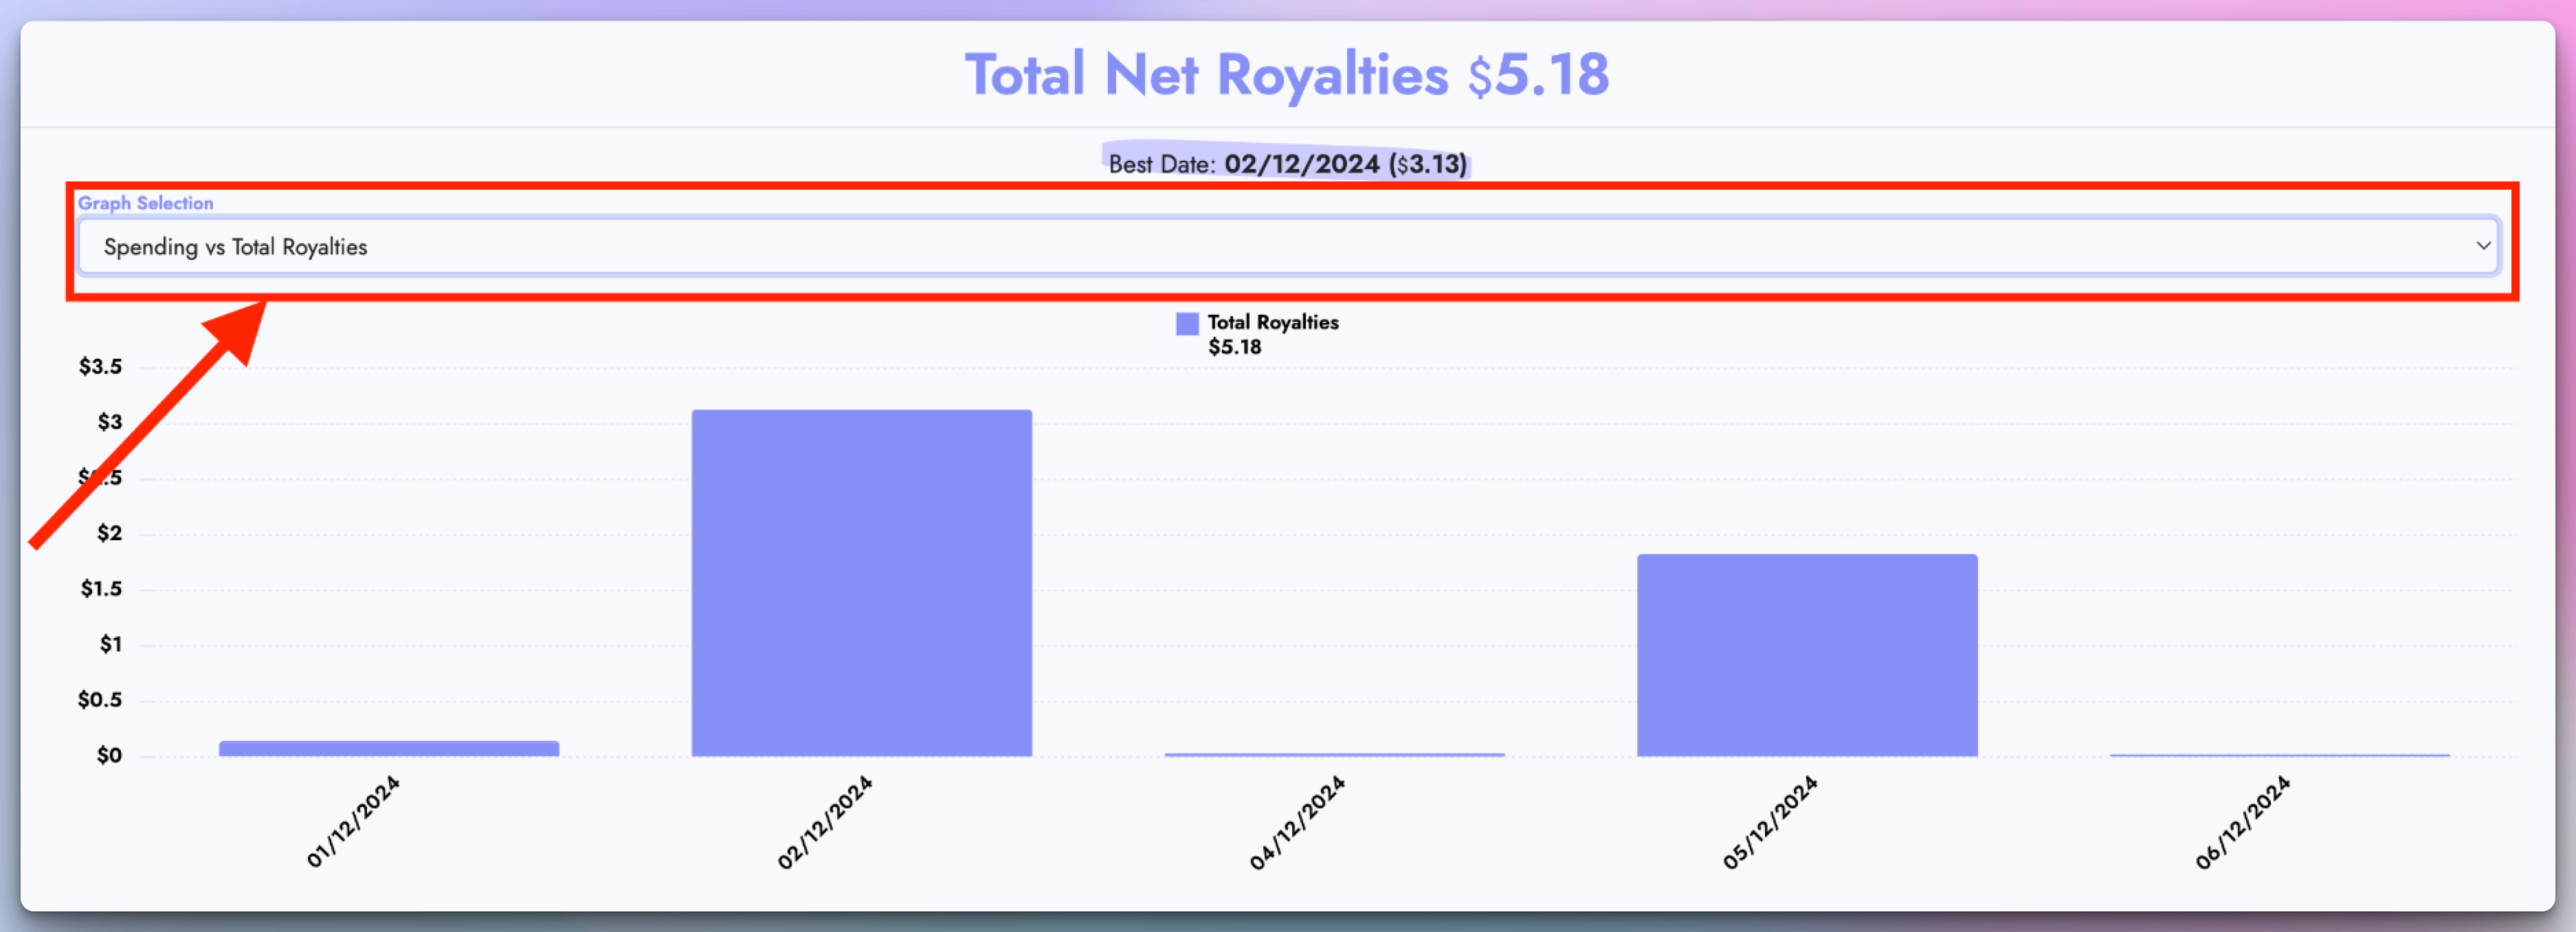
Below the filters you will be able to see your graph for the selected time period.
-
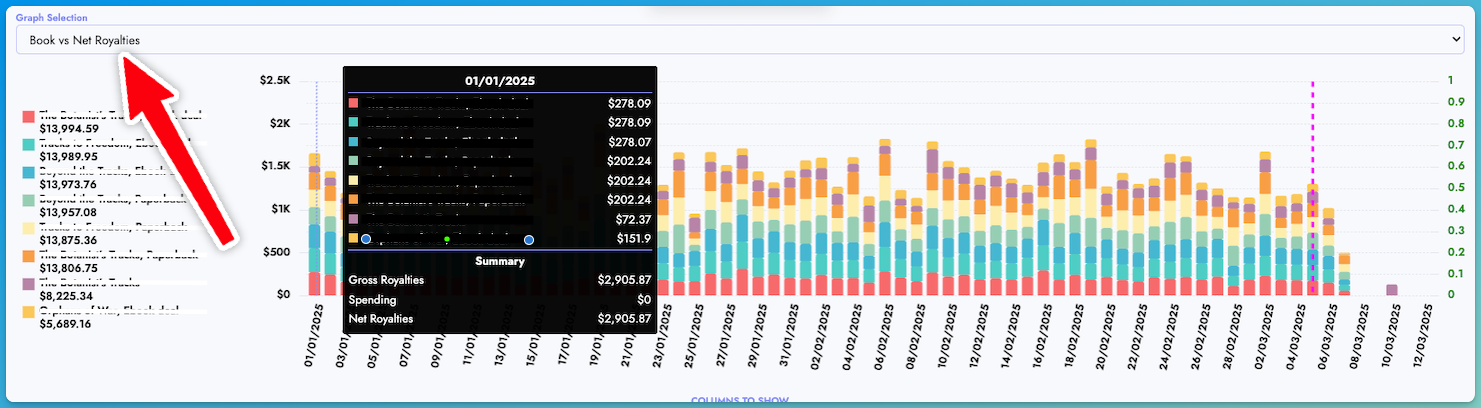
Use the dropdown at the top of the graph to select any graph you want to display, we hve a variety of graphs which you can use!
Book vs Net Royalties
- This graph option shows how your top 10 books for the selected time period have performed in terms of net royalties.
Table
-
At the bottom of page you can find the table with all the details for your books. These details are filtered based on the applied filters which you have added at the top of the page.
-
You can use the dropdown at the top of the table to show/hide any column you want, so you can focus only on the information you want.
-
You can also grab a column by the header and move it left or right to re-arrange it in the order you want!
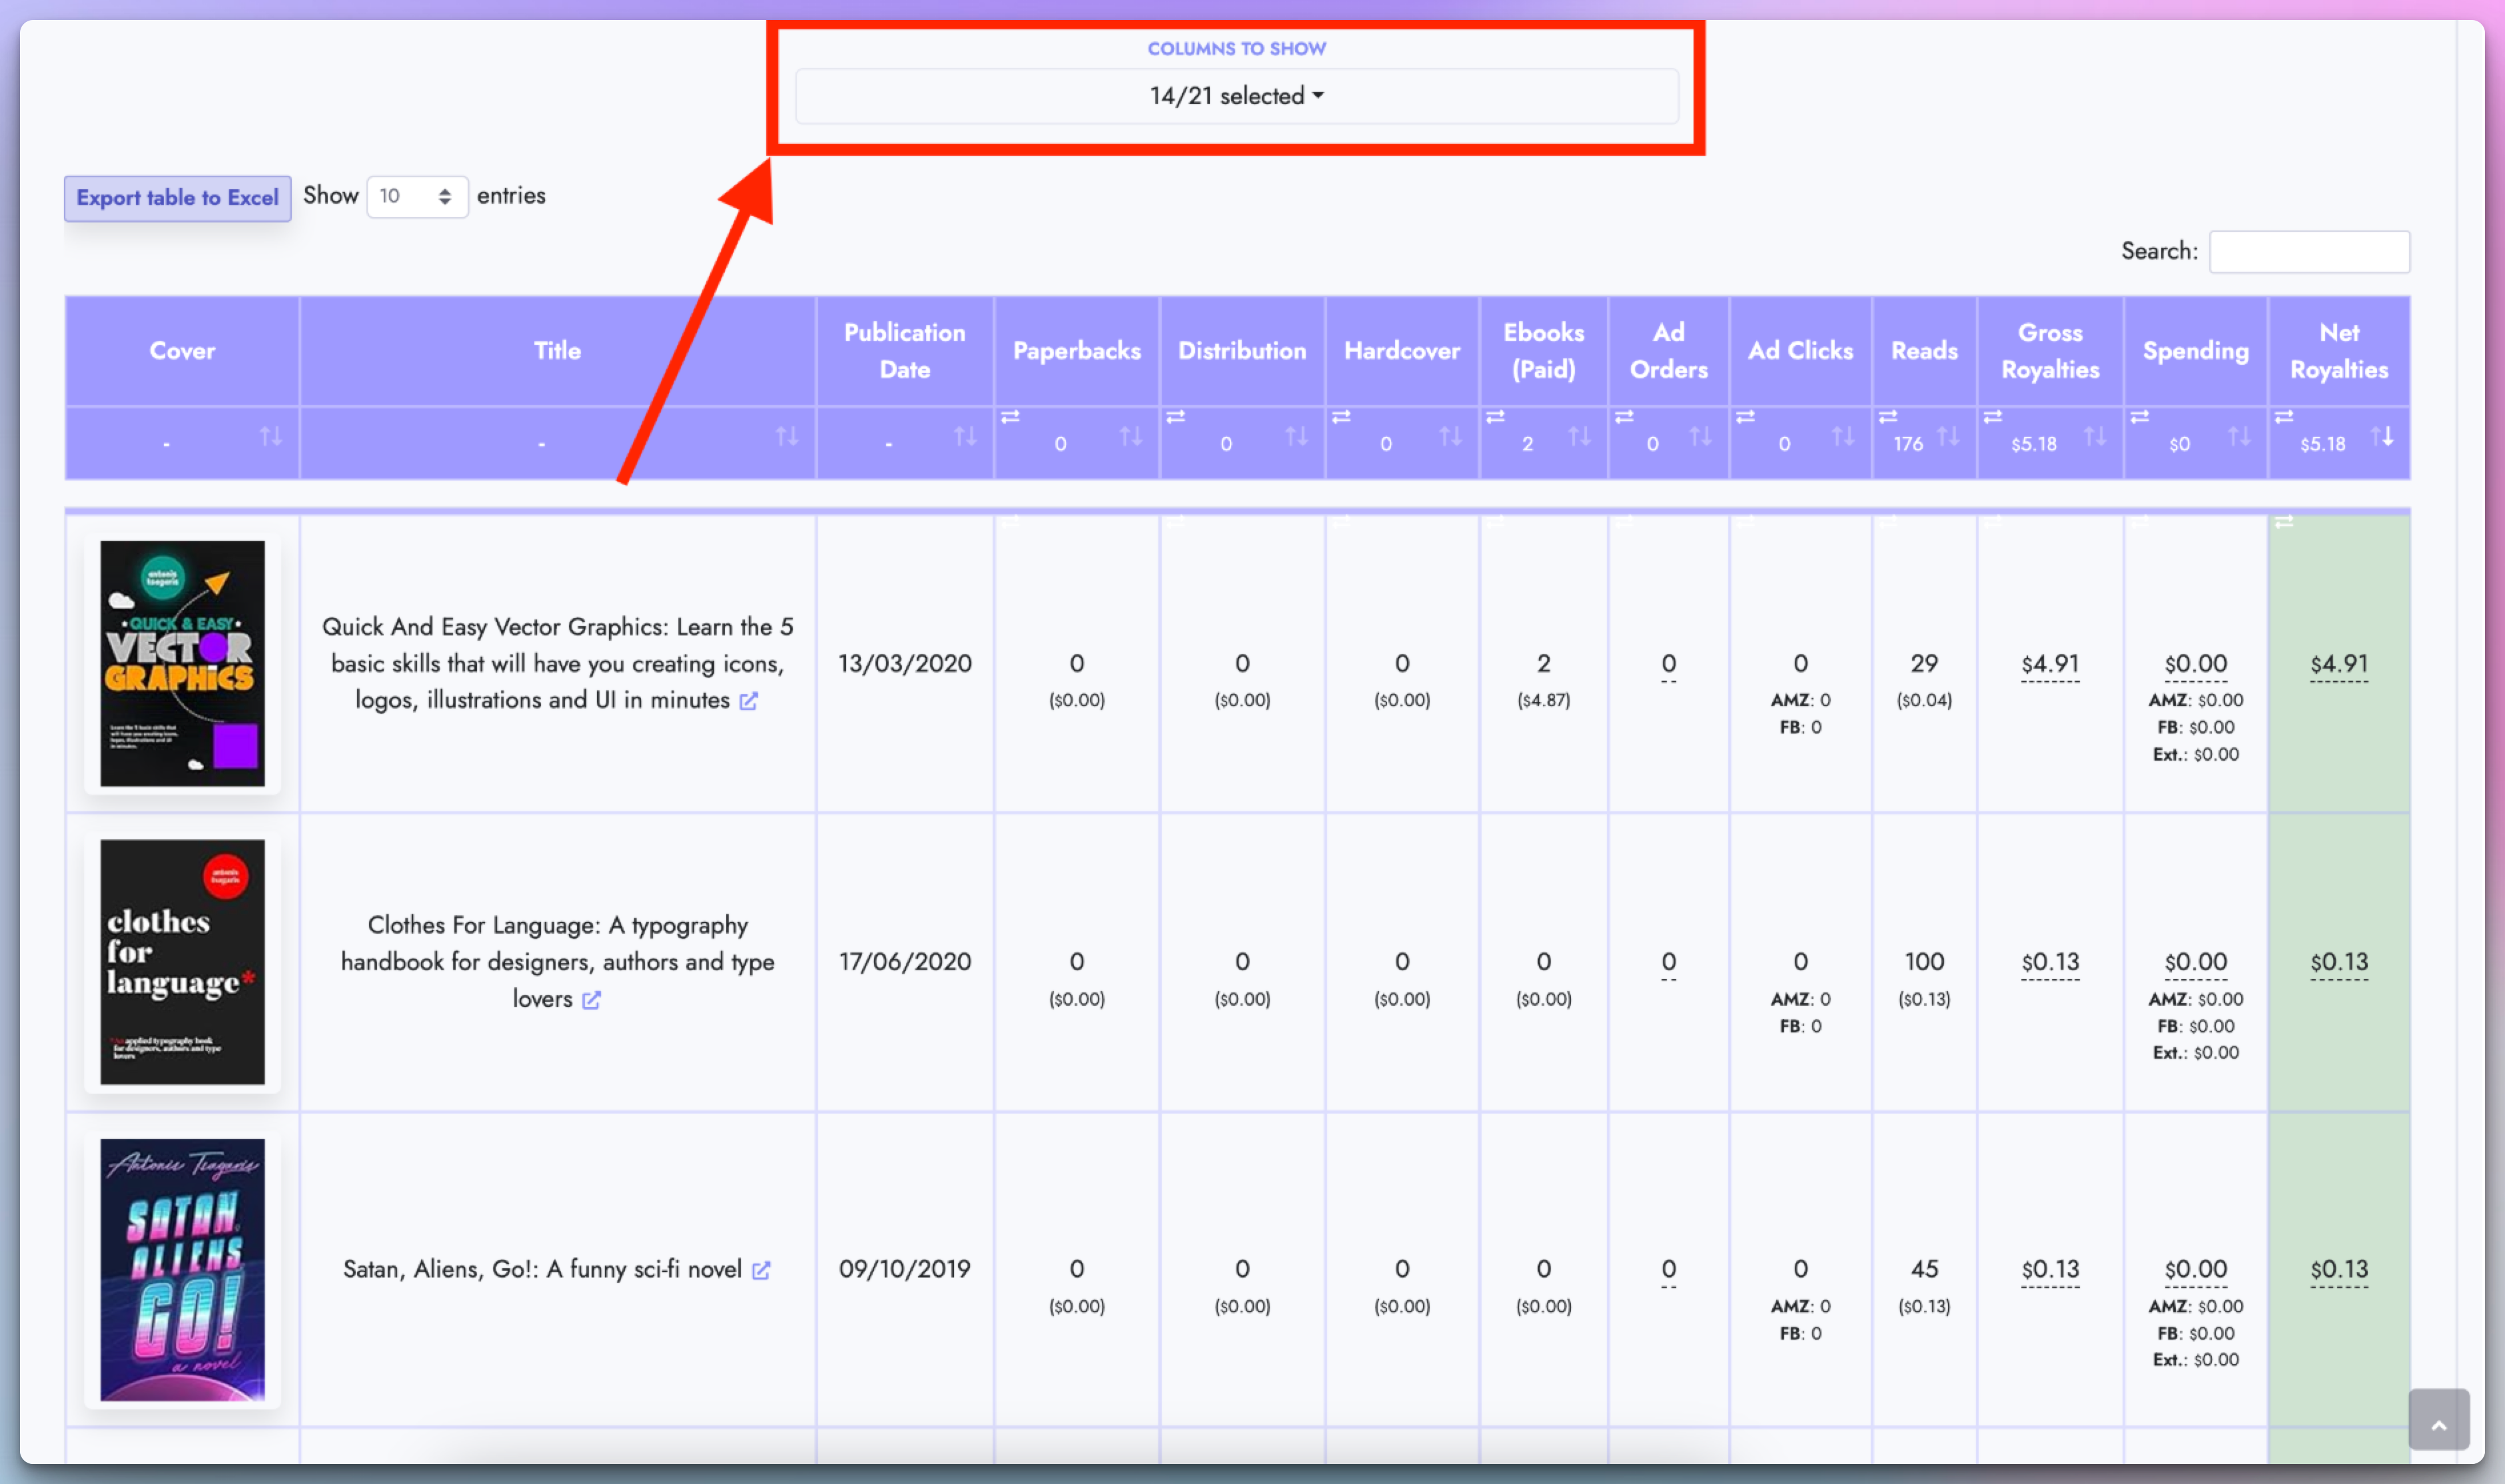
Table details
-
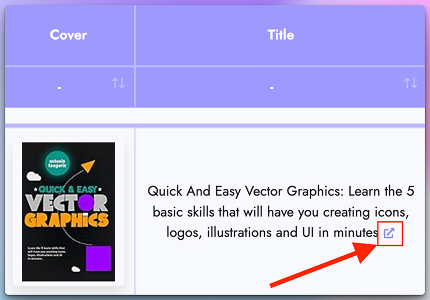
If you want to see the analytics of a specific book only, you can click the little purple icon next to the Book's title or ASIN and a new page will open, displaying the analytics of the selected Book Title or ASIN only, so you can analyze the specific book in more detail!
-
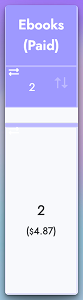
On each cell that displays the units sold for each format, you can also see the royalties corresponding to the quantity sold. In the screenshot below for example, 2 ebooks earned $4.87 in royalties.
-
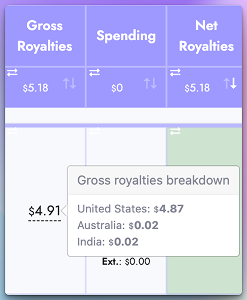
You can also hover over any row that has the dotted underline "-----" and a tooltip will appear with more details about the value displayed.
-
We also made easy for you to see which books are making money (green background) and which books are losing money (red background). Just look at the "Net Royalties" column at the far right of the table.

-
You can click on any column header to sort your data ascending or descending!
Downloading the data
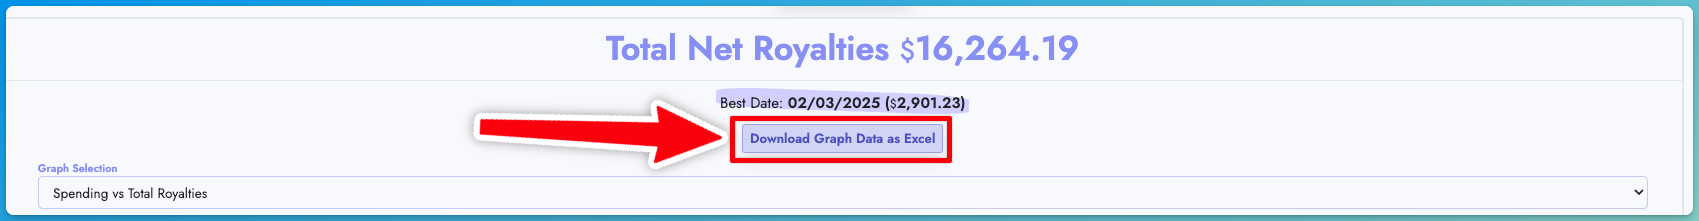
Download your graph data as an Excel file
- You can download the Graph data as an Excel file by clicking the "Download Graph Data as Excel" button at the top of the graph.
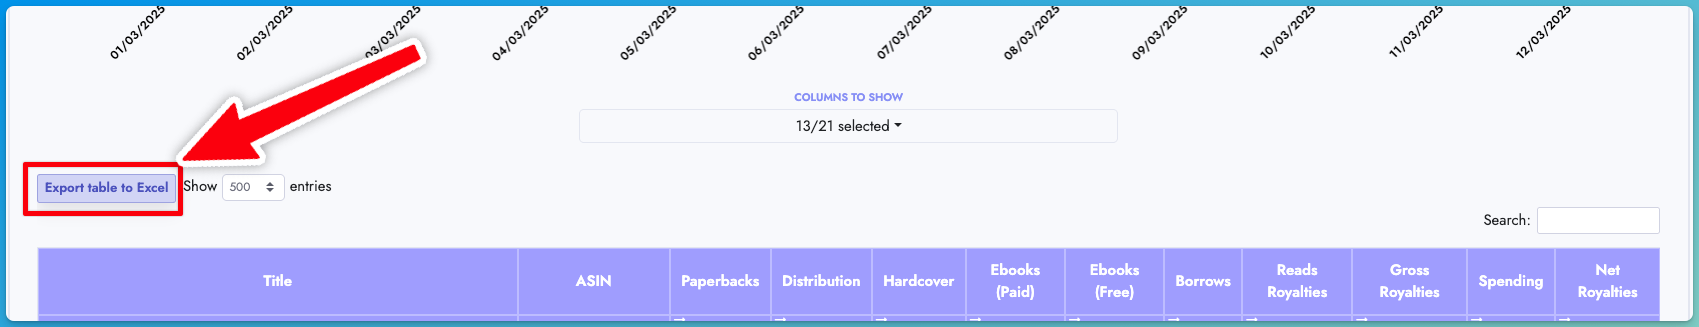
Download your table data as an Excel file
- You can download the table data as an Excel file by clicking the "Export table to Excel" button at the top of the table.